Combinatorial Coverage Measurement
Latest research:
Combinatorial Frequency Differencing. NIST Cybersecurity Whitepaper.- Describes measures of the frequency of combination coverage and difference between Class and Non-class elements in machine learning classification problems. Illustrates application of these methods for identifying weaknesses in physical unclonable function implementations.
Combinatorial Coverage Difference Measurement. NIST Cybersecurity Whitepaper.- Introduces a variety of measures that can be applied to understanding differences in combination coverage.
Measuring Test Quality with Combinatorial Coverage
D. Richard Kuhn, NIST, Raghu N. Kacker, NIST, Yu Lei, University of Texas Arlington
- There are few good methods for evaluating test set quality, after ensuring basic requirements traceability.
- Structural coverage, mutation testing, and related methods can be used if source code is available, but these approaches may entail significant cost in time and resources.
- Combinatorial methods make possible an alternative measure of test quality that is directly related to fault detection, simple to compute, and can be applied prior to execution of the system under test.
- It provides an inexpensive complement to current approaches for evaluating test quality.
How thorough are your tests? Can you provide a defensible, quantitative measure? These are vitally important questions for mission critical systems, but very difficult to answer with confidence, especially if tests were produced by third-party test developers.
Measurement methods derived from combinatorial testing that can be used in analyzing the thoroughness of a test set, based on characteristics of the test set separate from its coverage of executable code. The effectiveness of any software testing technique depends on whether test settings corresponding to the actual faults are included in the test sets. When test sets do not include settings corresponding to actual faults, the faults will not be detected. Conversely, we can be confident that the software works correctly for input combinations contained in passing tests.
Any test set, whether constructed as a covering array or not, contains a large number of combinations. Measuring combinatorial coverage, i.e., the coverage of t-way combinations in a test set, can therefore provide valuable information about test set quality. Combinatorial coverage includes a number of advantages for assessing test quality:
Computed independently of other evaluations of test quality. Combinatorial coverage provides additional information for decision-makers, and may be used in conjunction with structural coverage, mutation testing, or other approaches.
Direct relationship with fault detection. The size of the input space spanned by the test set, a significant aspect of fault detection, can be measured by the number of t-way combinations up to an appropriate level of t. The proportion of t-way combinations covered measures the fractional size of the input space that is tested.
Simple to compute and interpret. Because it is based on the input space of test values, there is no need to run the system under test to compute this measure of test set quality. Freely available tools can be used on any test set expressed as a matrix where rows are tests and columns are parameter values.
Measuring Coverage of Fault-triggering Combinations
An alternative to creating a combinatorial test set from scratch is to investigate the combinatorial coverage properties of an existing test set, possibly supplementing it with additional tests to ensure thorough coverage of system variable combinations. Determining the level of input or configuration state-space coverage can help in understanding the degree of risk that remains after testing. If a high level of coverage of state-space variable combinations has been achieved, then presumably the risk is small, but if coverage is much lower, then the risk may be substantial. The following example shows how to use this concept.
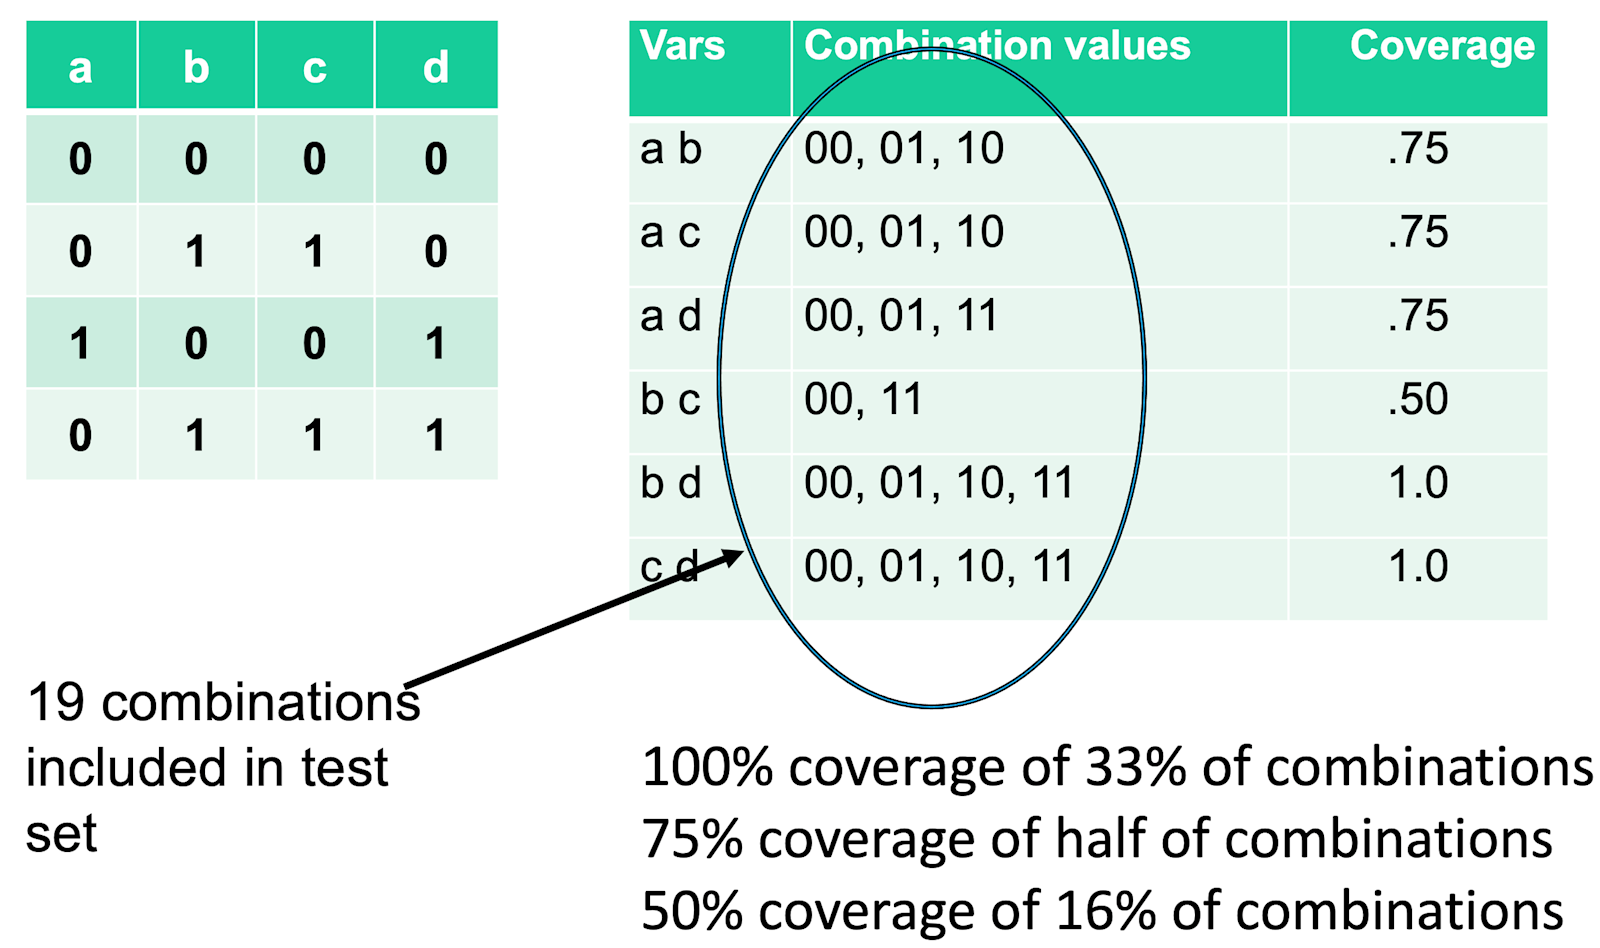
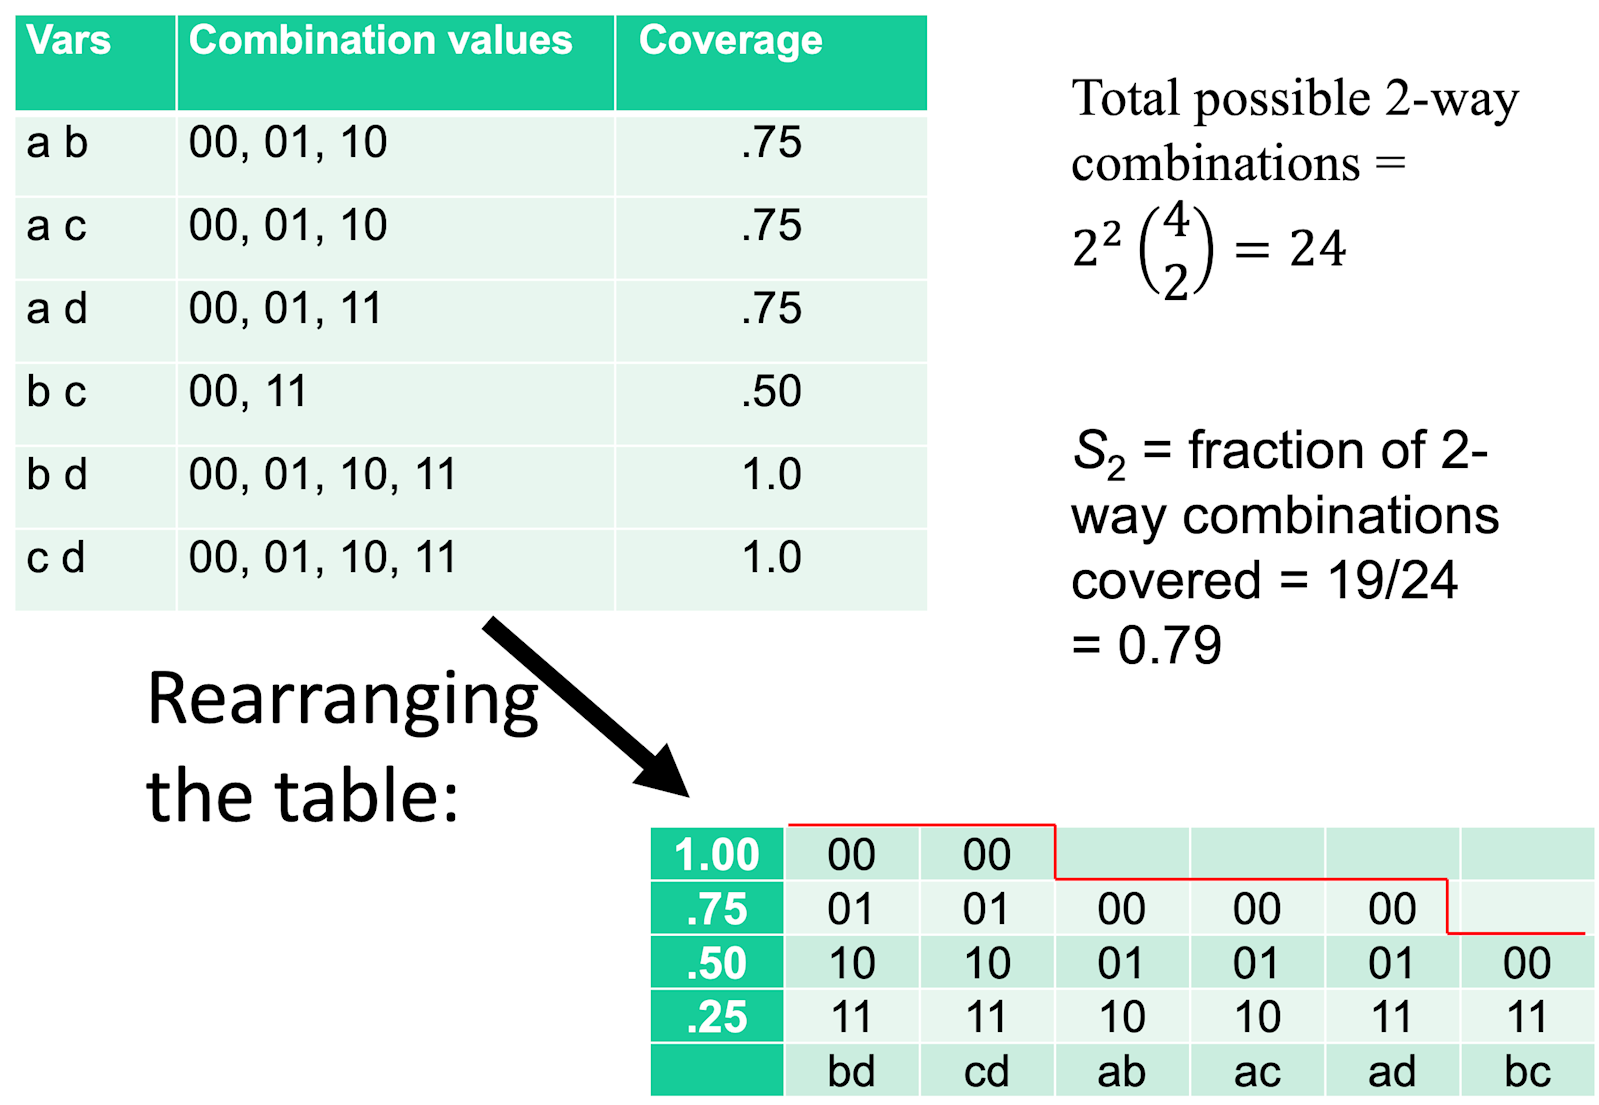
Example. Table I shows four binary variables, a, b,c, and d, where each row represents a test. Of the six possible 2-way variable combinations, ab, ac, ad, bc, bd, cd, only bd and cd have all four binary values covered, so simple 2-way coverage for the four tests in Table 1 is 2/6 = 33.3%. There are four 3-way variable combinations, abc, abd, acd, bcd, each with eight possible configurations: 000, 001, 010, 011, 100, 101, 110, 111.
Table 1. Test array with four binary components
To visualize the data above, we can imagine rearranging the table in descending order of combination coverage:
This transformation gives us the step-line graph below:
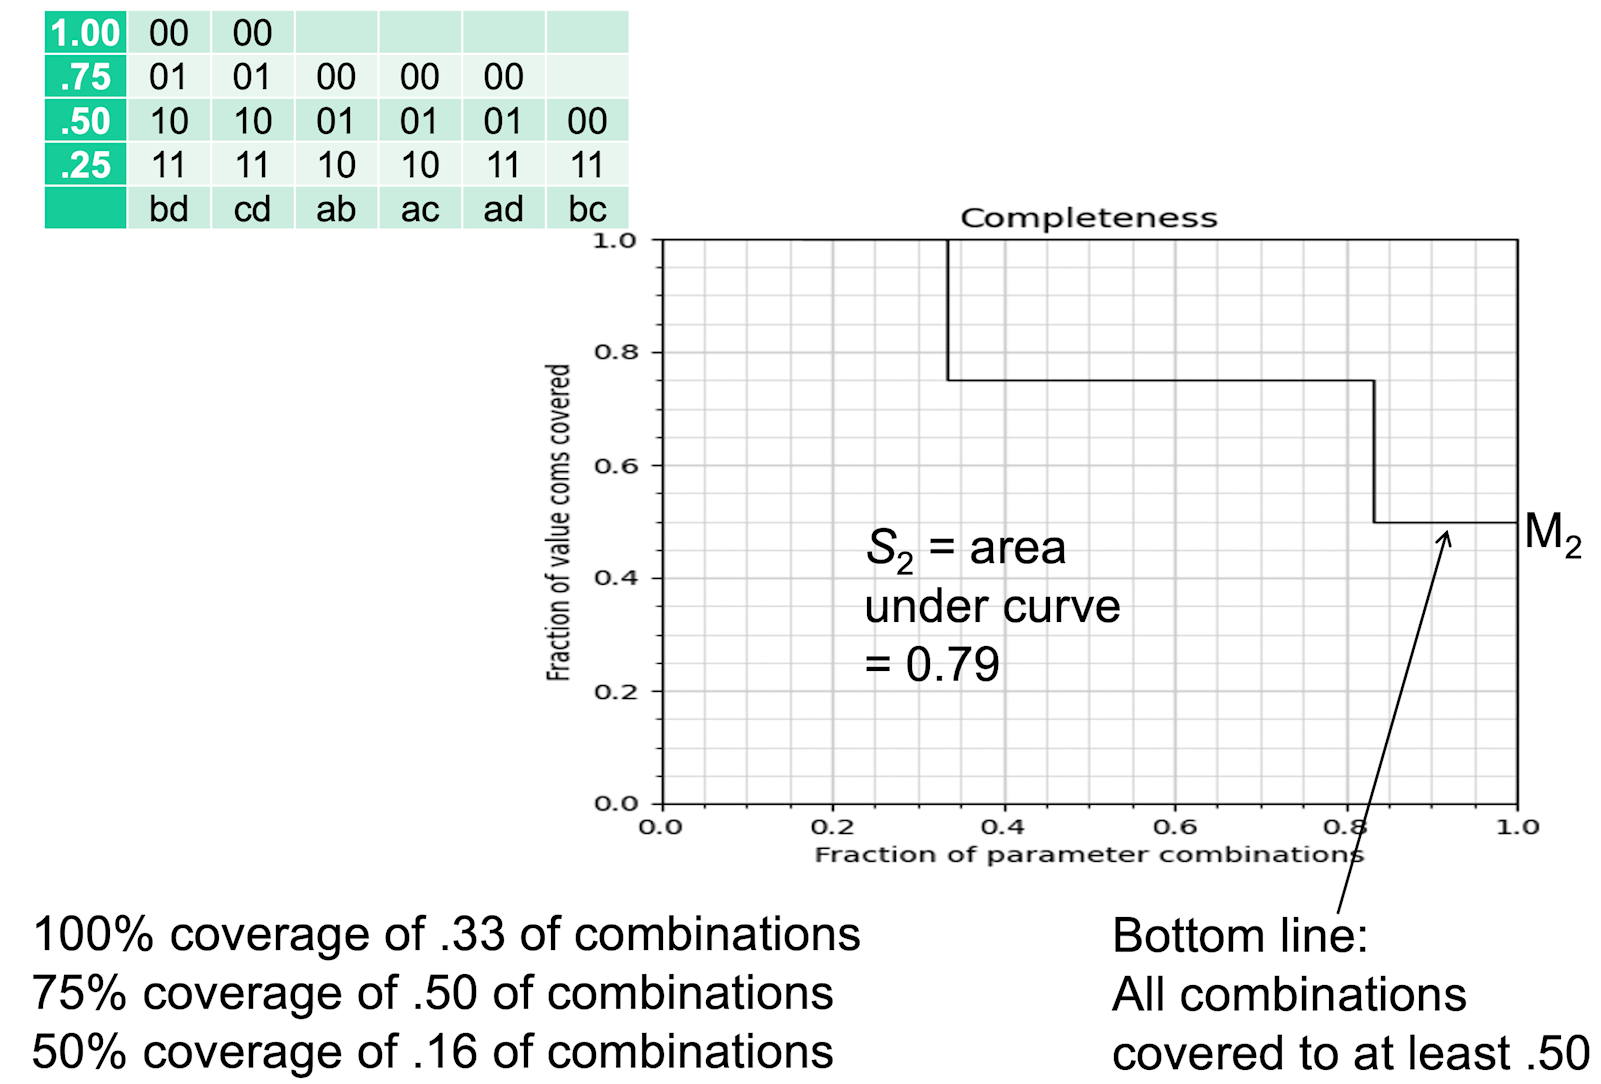
The graph shows that all combinations have been covered to at least the 50% level. But what does this mean for assurance? Think of the area under the curve as the proportion of combinations covered. Then the area above the curve represents the proportion of input combinations not covered in tests. We don't know what the code will do with these input combinations!
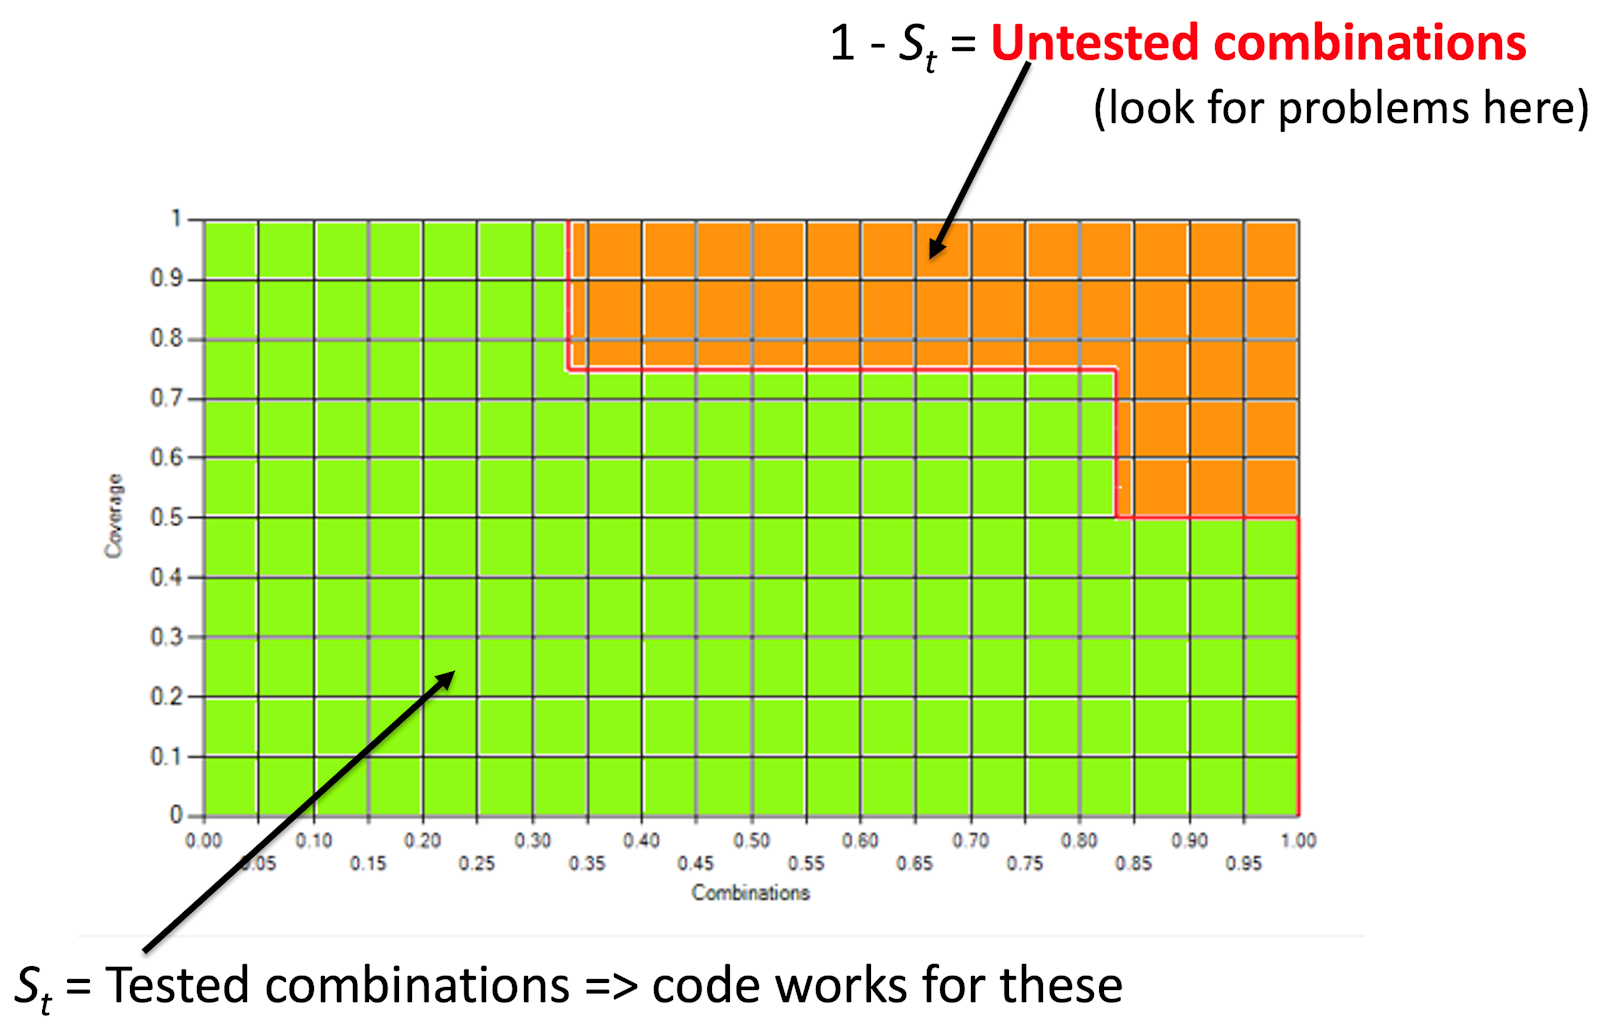
Note that the non-covered proportion of the graph refers to input space coverage, not statements or lines. This lack of coverage of the input space holds even if we have achieved 100% path coverage, because the combinations have not been tested.
A Real-world Example
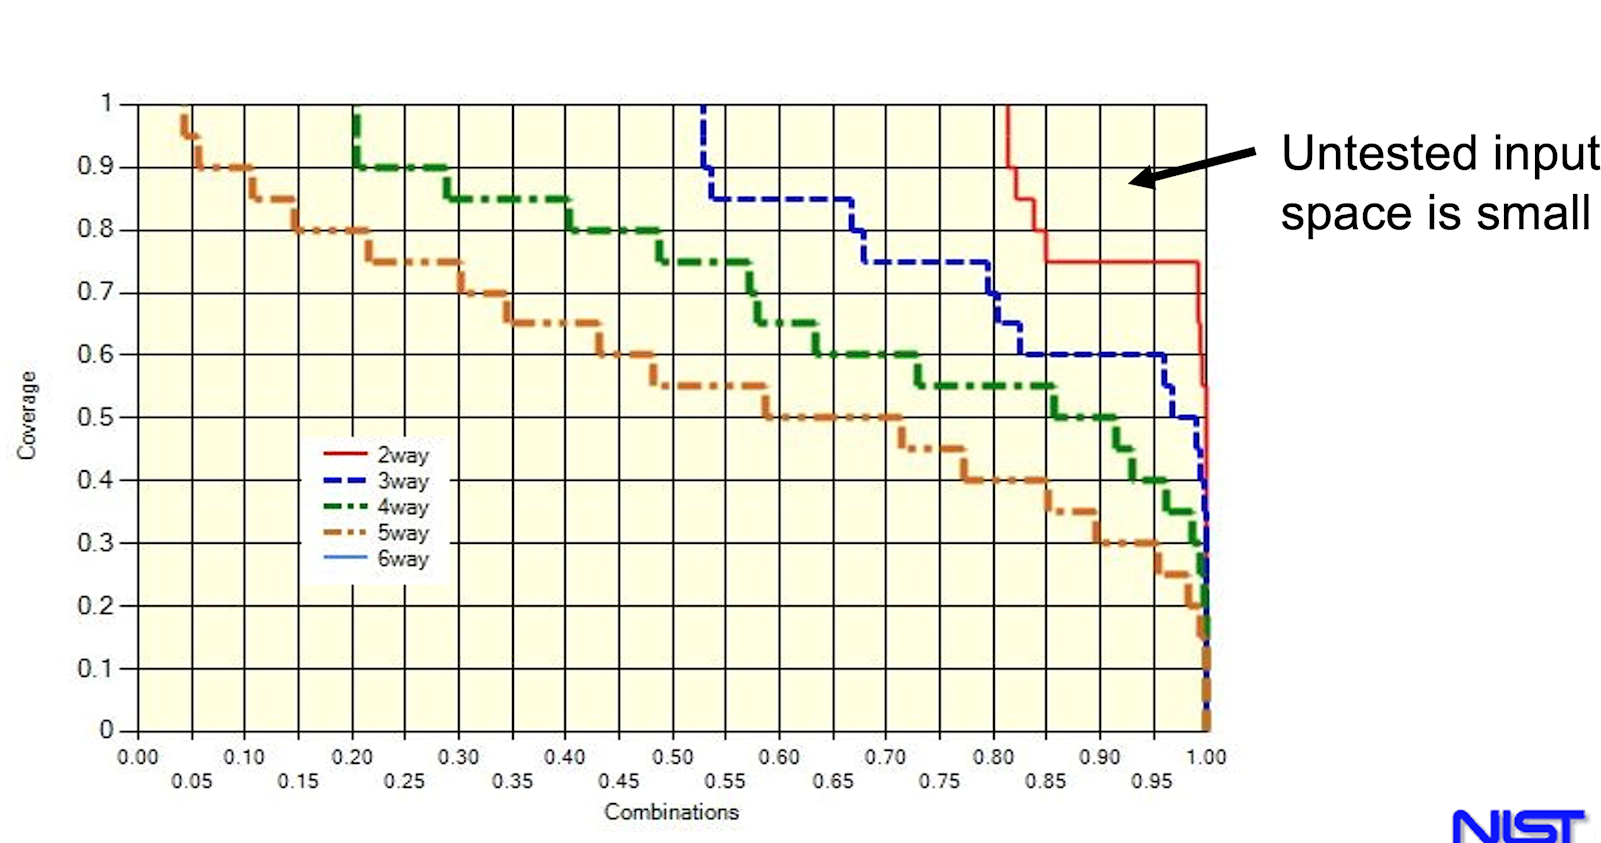
The methods described in this paper were originally developed to analyze the input space coverage of tests for spacecraft software. A set of 7,489 tests had been developed, although at that time combinatorial coverage was not the goal. With such a large test suite, it seemed likely that a huge number of combinations had been covered, but how many? Did these tests provide 2-way, 3-way, or even higher degree coverage?
The original test suite had been developed to verify correct system behavior in normal operation as well as a variety of fault scenarios, and performance tests were also included. Careful analysis and engineering judgment were used to prepare the original tests, but the test suite was not designed according to criteria such as statement or branch coverage. The system was relatively large, with the 82 variable configuration 132754262 (three 1-value, 75 binary, two 4-value, and two 6-value). Figure 3 shows combinatorial coverage for this system (red = 2-way, blue = 3-way, green = 4-way, orange = 5-way). This particular test set is not a covering array, but pairwise coverage is still relatively good, because 82% of the 2-way combinations have 100% of possible variable-value configurations covered and about 98% of the 2-way combinations have at least 75% of possible variable-value configurations covered.
Tool for Computing Combinatorial Coverage
See the Downloadable Tools section of this site for the CCM tool that is freely available and can compute a variety of additional measures, and produce the reports included in examples above. CCM was developed by NIST and the Centro Nacional de Metrologia, Mexico.
Reference
D.R. Kuhn, I. Dominguez, R.N. Kacker and Y. Lei. "Combinatorial Coverage Measurement Concepts and Applications", 2nd Intl Workshop on Combinatorial Testing, Luxembourg, IWCT2013, IEEE, Mar. 2013.
